10 Characteristics of a Spectacular Infographic
Opinion by Psylocke on Sep 30, 2022
An infographic is a great way to present complex information in an easy-to-digest format. They can help you tell your story in a visually appealing way, which is why they have become so popular in recent years. Infographics are now being used in all industries, from marketing to education.
However, creating an infographic is not as simple as throwing some data into a pretty picture. There is an art and science to creating a compelling infographic. Here are 10 characteristics of a spectacular infographic:
1. A great headline
Like any other content, your infographic needs a great headline to grab attention. The headline should be short, punchy, and to the point. It should give readers a clear idea of the infographic and why they should care. A great headline is the first step to getting people to read your infographic.
2. A clear purpose
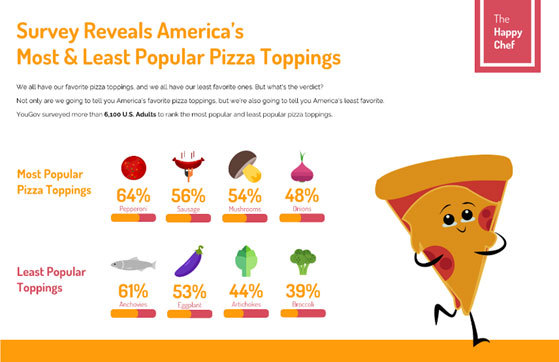
Your infographic should have a clear purpose from the start. What are you trying to accomplish with your infographic? Are you trying to educate, inform, or entertain? Your infographics should be laser-focused on achieving its specific goal. Trying to accomplish too many things will make your infographic confusing and ineffective. Make sure everything from the headline to the design supports your overall purpose. Having cohesiveness throughout the different aspects of your infographic is also essential, as doing so supports delivering the purpose of the infographic clearer and more effectively.

Photo by Venngage
3. A well-designed layout
The layout of your infographic is just as important as the design. Everything should be easy to find and understand at a glance. The most important information should be featured prominently, while supplementary data can be included in smaller text boxes or sidebars. The layout should be logical and easy to follow, with a clear visual hierarchy. Good use of whitespace is also vital to keep things feeling clean and uncluttered. For example, if you're creating a timeline infographic using a template from a timeline maker, ensure that the dates are lined up consistently and correctly, with the right spacing in between them.
4. A solid visual identity
Your infographic should have a strong visual identity that sets it apart from other content on the web. This can be achieved through consistent branding elements like colors, fonts, and logos. Or, you may want to create a unique visual style for your infographic. Either way, make sure your visuals are memorable and help your infographic stand out. Though having a solid visual identity is essential, it's also important not to go overboard. Keep your visuals simple and clean, so they don't distract from the actual data and information in your infographic.
5. A mix of data types
Your infographic should include a mix of different data types to capture attention. This could include statistics, charts, graphs, maps, infographics, images, and videos. Using a variety of data types will not only make your infographic more interesting to read, but will also help you communicate your message more effectively.
6. Easy-to-understand data
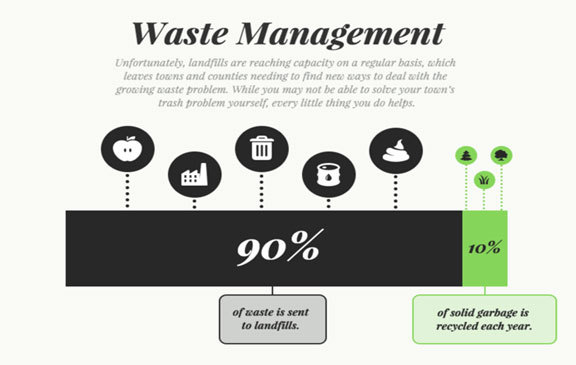
Your data should be easy to understand at a glance. Data visualization is an integral part of any infographic, but it's only effective if the reader can understand what they're looking at. Be careful not to overwhelm your audience with too much data, and ensure that any visuals are clearly labeled and easily interpreted.
7. A relatable story
People are more likely to care about your infographic if it tells a relatable story. Data is essential but can be dry and dull if not presented excitingly. Find a way to make your data relevant to your audience and tell a story that they can connect with on an emotional level. This will help your infographic leave a lasting impression.

Photo by Venngage
8. An attention-grabbing design
The best infographics should have an attention-grabbing design that makes them visually appealing. This doesn't mean that your infographic needs to be flashy or over-the-top, but it should be well-designed and visually appealing. The design should reinforce the overall message of the infographic and help guide the reader through the data.
9. A call to action
Your infographic should have a clear call to action that tells the reader what they should do next. Whether you want them to share the infographic, sign up for your newsletter, or learn more about your company, make sure that your call to action is clear and compelling. Including a strong call to action will help ensure that your infographic successfully achieves its goals.
10. A place for sharing
Make sure your infographic has a place for sharing, whether it's social media buttons or an embed code. You want people to be able to share your infographic easily, so make it easy for them to do so. The more people see your infographic, the more successful it will be.
Creating a compelling infographic may not be easy initially, but it is well worth the effort. If done right, an infographic can help you tell your story in a visually appealing way and reach a larger audience. Keep these 10 characteristics in mind when creating your following infographic, and you'll be on your way to success. If you’re still looking for the best infographic creator that provides you with other infographic examples and different examples, such as timeline templates, project plans, performance review examples, and more, look no further! Sign up today at Venngage!
Moderator, NoobFeed
Latest Articles
No Data.

