
AMD Zen 6 Benchmark Shows 24% Higher Single-Thread Performance
AMD Zen 6 benchmark results suggest a 24% single-thread performance increase over Zen 5, offering insight into upcoming Ryzen processors.
Hardware by Nahe Yan on Oct 25, 2026
AMD Zen 6 is beginning to appear in benchmark results, offering an early look at the performance changes over Zen 5. Geekbench 7.1 results show single-thread performance, instruction support, and the improvements expected from the next-generation Ryzen processors. The results also shed light on Zen 6C, the denser-core variant, and how its architecture could affect gaming and other workloads.
We finally have a Zen 6 benchmark, and the results are interesting because they better clarify the single-thread performance gains over Zen 5. Comparisons are starting to appear online, with Geekbench 7 results showing a potential performance increase. A WCCF Tech headline reports 24% higher per-clock performance over Zen 5, suggesting a performance boost for Ryzen upgraders.

AMD Zen 6 Benchmark Results Appear Online
We can dig into these results to understand what AMD has been doing with the Zen 6 architecture. Geekbench takes advantage of additional instructions supported by Zen 6, which matters when analyzing the scores. We also need to consider the rest of the Zen 6 lineup because differences between the core variants help explain AMD's engineering direction.
The results originally came from HXL, who appears to have been among the first to post them. They were recorded using Geekbench 7.1 for Linux with AVX2. Another result was also posted, but it has since been removed from the internet. Screenshots of the result remain available, allowing us to examine the reported performance.
The Geekbench 7.1 Linux AVX2 result shows a single-core score of around 2,850 points and a multicore score of approximately 68,400 points. The processor is identified as a 9996, which we will refer to as the 96 for the rest of the discussion. It reportedly features 256 cores based on the Zen 6C architecture.
The benchmark lists a base frequency of 4.12GHz, although it doesn't correctly identify some processor information. Geekbench doesn't always recognize every processor specification accurately, so we should treat some of these details with caution. However, the results further confirm the readily available information, including the reported 1MB of L2 cache per core.
Zen 6C Performance Compared With Zen 5
We used several processors to compare the Zen 6C results with existing Zen 5 hardware. One of them is the EPYC 4545P, which runs at approximately 5.5GHz for single-thread workloads. Its Geekbench results reach the low 3,000s, with one reported result reaching around 3,260 points. Another comparison involves the Ryzen 7 9700X.
These results help us understand how Zen 6C compares with Zen 5, though the comparison has some limitations. The original Zen 6C result is no longer available directly, and we cannot confirm every detail of its operating conditions. For all we know, the processor may have run at a different frequency than the benchmark reports. Still, the available specifications suggest that the result is within a plausible range.
Zen 6C is a denser core design, and that distinction matters when comparing the architecture with other Zen 6 variants. EPYC processor also has additional memory channels, which might help even in single-thread workloads. However, we don't have complete information on memory frequency, timings, or latency.
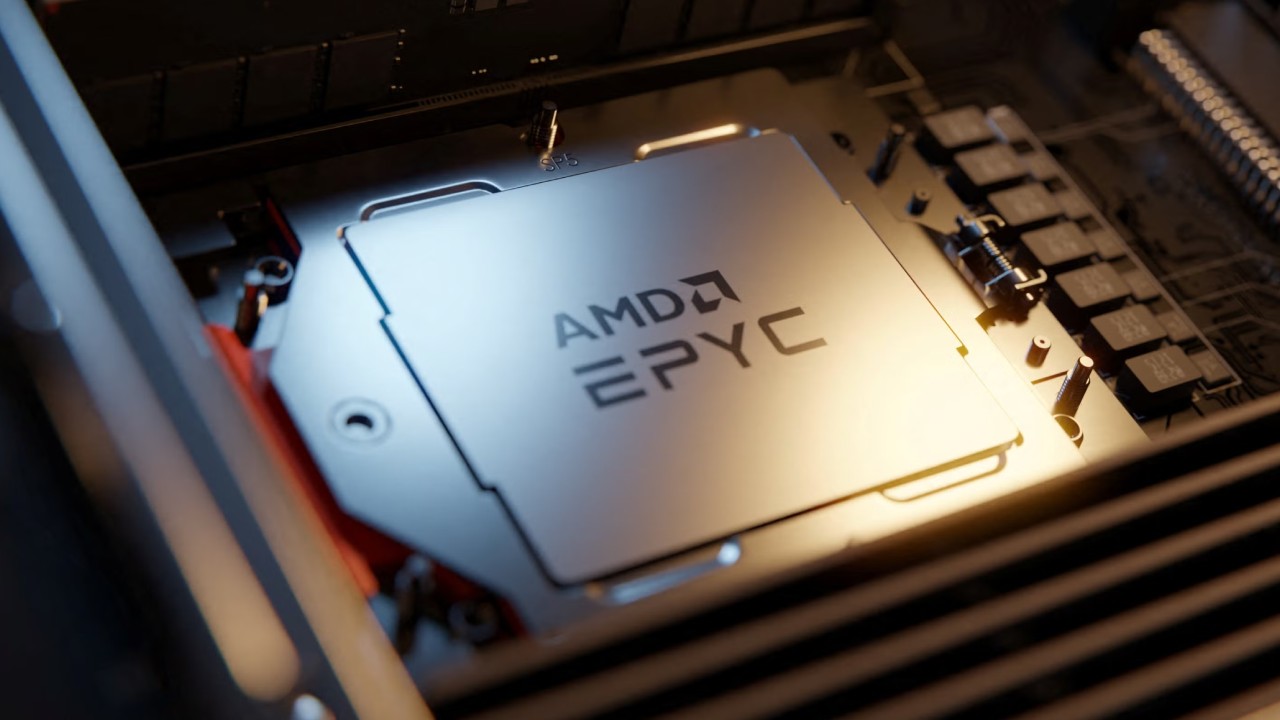
Zen 6 supports instructions and extensions such as AVX-512 FP16 and AVX-VNNI.
These instructions matter because Geekbench 7.1 may use them in some of its workloads, potentially affecting the results compared with Zen 5. When we examine the comparison results, performance differences vary by workload. EPYC processor used in the comparison also has tuned DDR5 memory and fabric clock settings, which contribute to its performance.
Looking at the individual results, file compression shows about a 7% difference, navigation is about 8% faster, and the HTML5 browser workload shows about a 23% difference. Ray tracing is about 12% higher, structure from motion is about 18% higher, and game physics is about 10% higher.
We cannot say exactly which instructions Geekbench 7.1 uses in each workload or how heavily it relies on them. Some results may benefit more from the additional instructions than others. However, these differences indicate the performance changes we could see across different workloads.
Editor, NoobFeed
Gaming Hardware Updates
No Data.